02 — Case study
Indicator Card Redesign
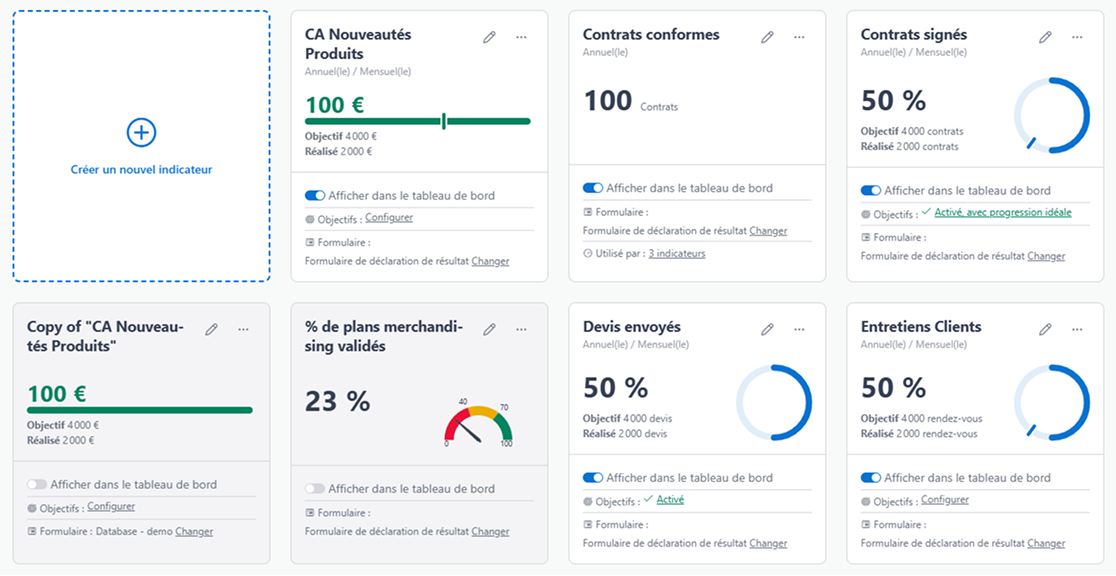
Indicators are one of the two pillars this product stands on, and there are 204 ways to configure and display one. Two things were wrong. Nothing on the card read first, so nobody could see at a glance where they stood. And the layout gave a main indicator no more weight than a secondary one, on the dashboard and in the configuration screens alike.
The problem, measured
The dashboard is one of two pillars this product stands on, and the indicator card is what a dashboard is made of. One card, one target, one result, repeated down the page for however many things a person is being measured on this period.
Which means the card is not really a component. It is a reading experience that happens several times per screen, and anything wrong with it is wrong several times over.
There are 204 possible ways of configuring and displaying an indicator. I know, it’s a
lot, and it’s one of the reasons Customer Support had their hands full all the time. But
that meant they were also the best source of direct client feedback for the product team.
- 2 computations
- 3 aggregation options
- 2 periodicity options
- 17 display options
The pitch
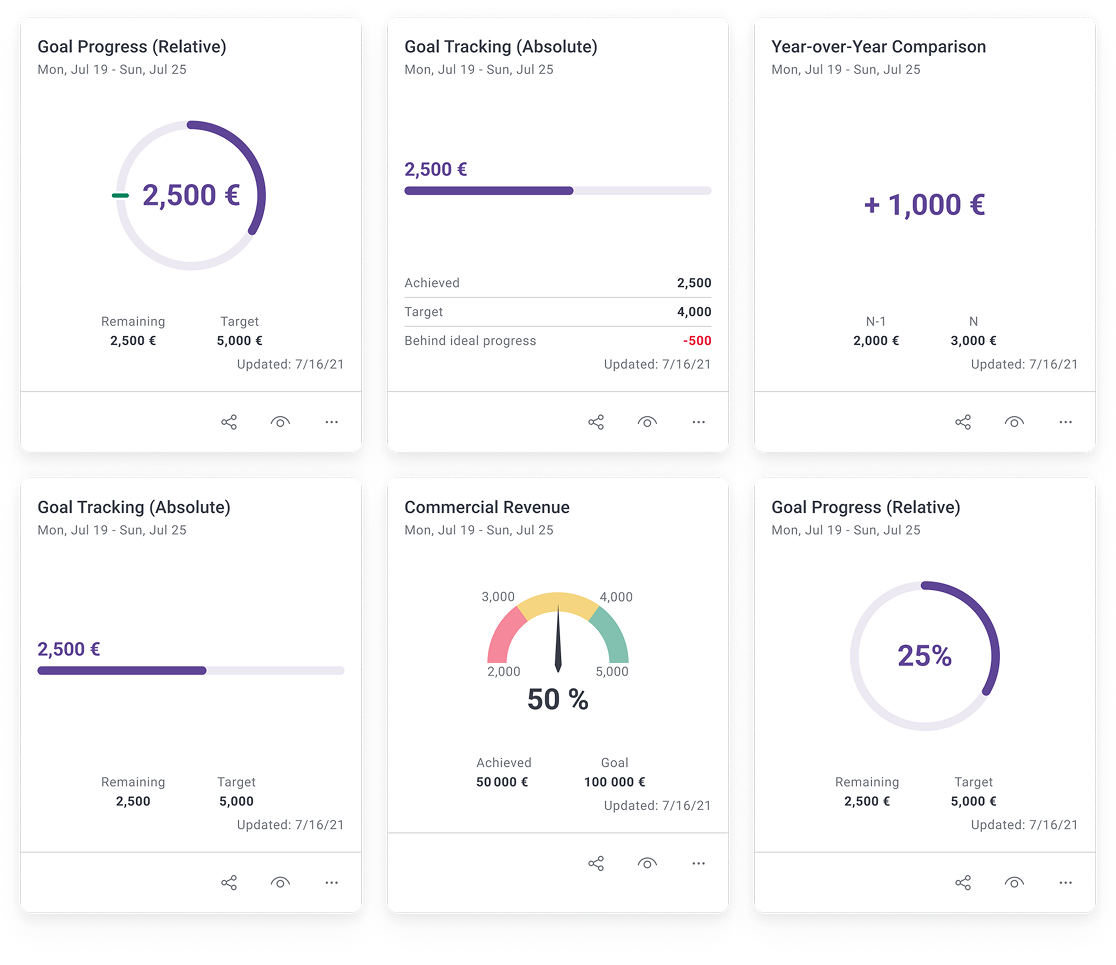
The number was inside the ring. Every person opening this dashboard arrives with the same question: where am I against my target? The answer to it was set at roughly a third the size of the graphic wrapped around it. The ring was the loudest thing on a card whose job was to report a figure. And we had to keep that font size on all the other indicators, even the simple ones with no progress bar, so they would not pop out against the rest.
The number was set in the client’s brand colour. This is a white-label product, so that colour is different for every deployment. A headline figure whose contrast against white depends on which client you are is a legibility problem that only appears for some of them, and only after the sale.
The card made you do arithmetic. It showed Achieved: 22 and Goal: 50, and left “so, 28 to go” as an exercise for the reader. Twenty-eight is the number a person acts on. It was the one number the card did not print.
Too many info sections. All of it mattered. But laid out the way it was, none of it could be the thing you looked at first. There was basically no hierarchy.
All four problems have the same consequence and it is structural: the card was portrait. Tall cards in a grid mean fewer per screen. People scrolled, and missed the conclusion the dashboard was supposed to hand them.
update date
A dashboard you have to scroll is a list.
Before — the dashboard as it shipped
The main indicator
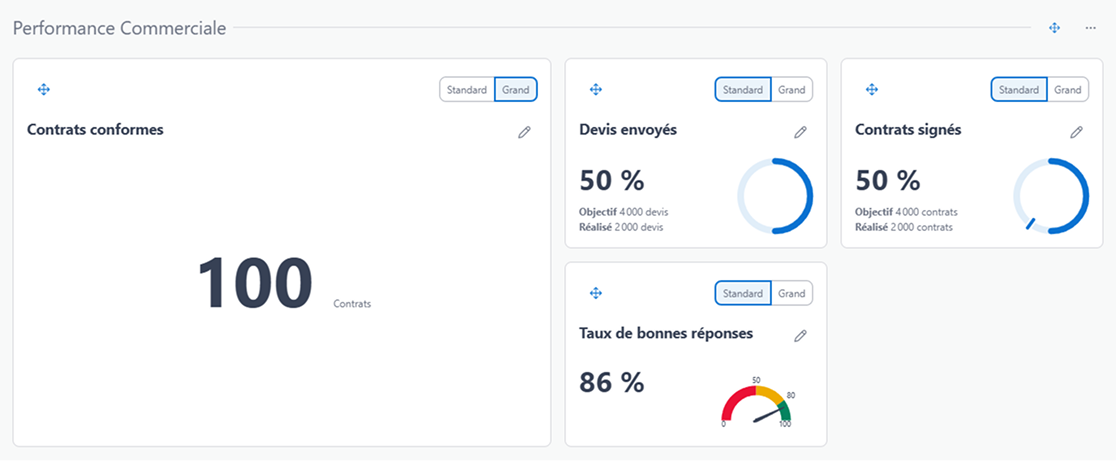
Our clients could configure some of the indicators to be main indicators, spread
across the whole width of the grid, four small indicators wide. After years of setting
their dashboards up this way, the layout they settled on was one main indicator followed
by four secondary ones. The grid’s 4 → 2 → 1 fallback kept that arrangement in order.
The dashboards looked bad, though. That huge indicator took all that space and said nothing the small ones did not.
Mobile was worse. The main indicator fell back to looking exactly like the rest, and the “important” factor was gone.
Desktop view
Tablet view
Mobile view
What I built
Before
After
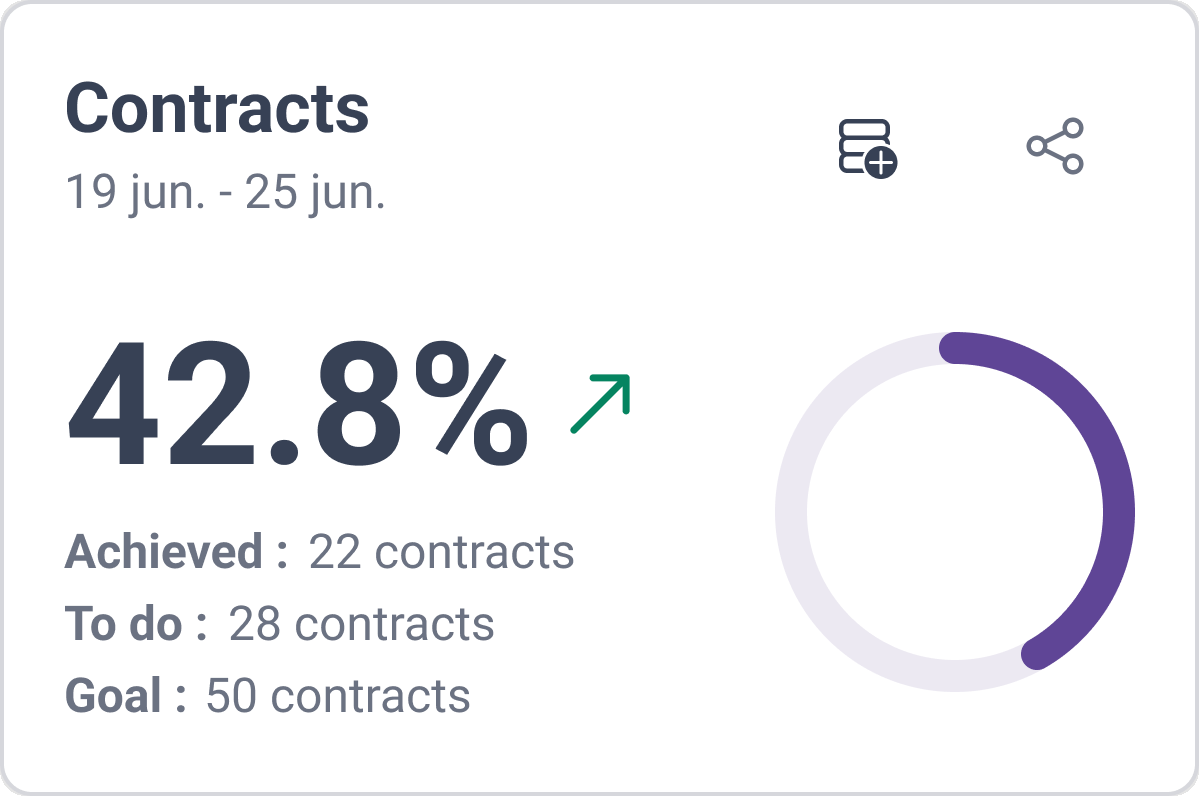
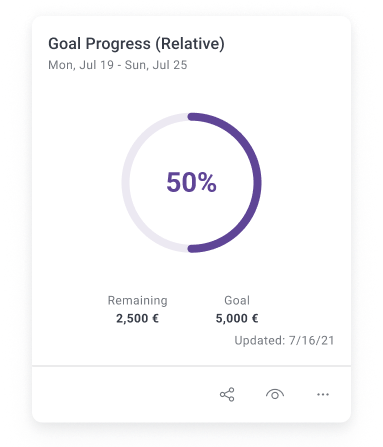
The figure became the headline, at display size, in ink rather than in the theme colour. It is the first thing read on the card now, and it reads the same on every deployment.
The progress bar survived, but it was demoted. It moved to the right at a smaller size, with nothing inside it. That is the correct job for it: a progress ring is very good at conveying roughly how far round at a glance, and very bad at being a label. Removing the number from its centre let it do the first thing without pretending to do the second.
Better information hierarchy. The missing figures went right under the main score, so the numbers add up in front of you. No guessing, no arithmetic.
No more actions bar. Share, add a score, see details and the rest moved up into the card header, which is separate from the body. For the details you click either the title in the header or anywhere in the body. Sub-grids keep everything on the same line however long the content gets.
After — the redesigned card
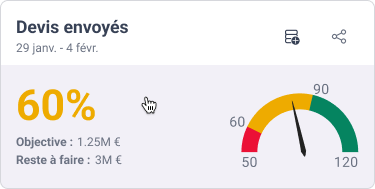
Grid optimisation. Most clients ran the one-main-plus-four combination, so the new
main indicator had to fit a 4 → 2 → 1 grid vertically as well as horizontally. We gave
it two columns and two rows. Our most conservative clients had nothing to complain
about, the fallback stopped breaking, and a few clients went and built configurations we
had not thought of. It stays big on mobile, which is the point of calling it main.
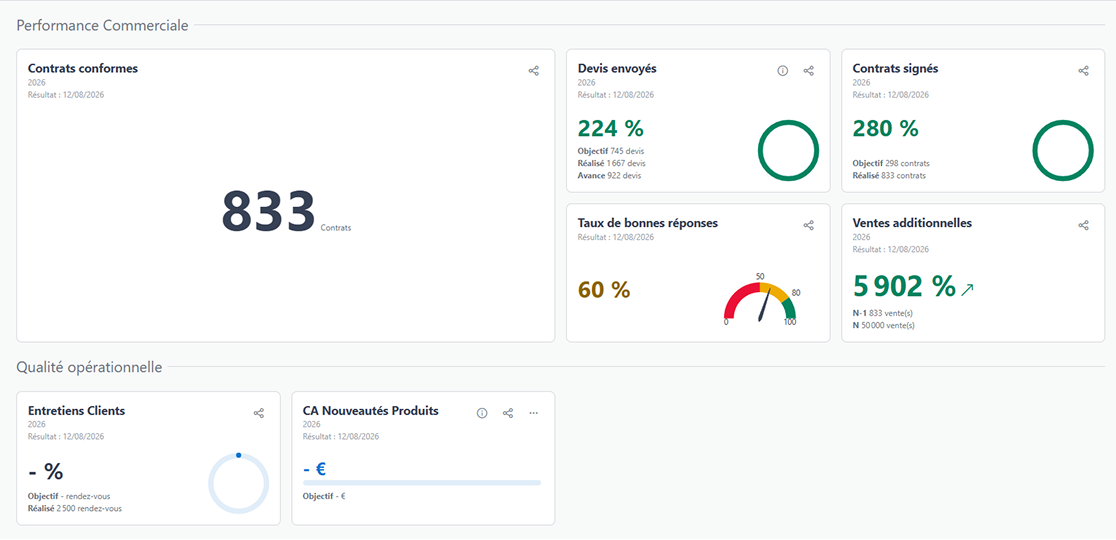
Configuration got the same treatment. The cards in the Config and Organize screens now read the way they read on the dashboard itself, instead of being a second thing to learn. Customer Support liked that one a lot.